Four streams more than doubled throughput on two Arc Pro B60s
Four streams moved the queue faster, with a longer wait for replies to start. Here’s how to test the tradeoff on your own server.
When a local AI server runs chat and batch jobs on the same GPUs, its concurrency limit decides how quickly the queue moves and how long someone waits to see a reply start. A batch of jobs can benefit from a setting that makes chat feel slower.
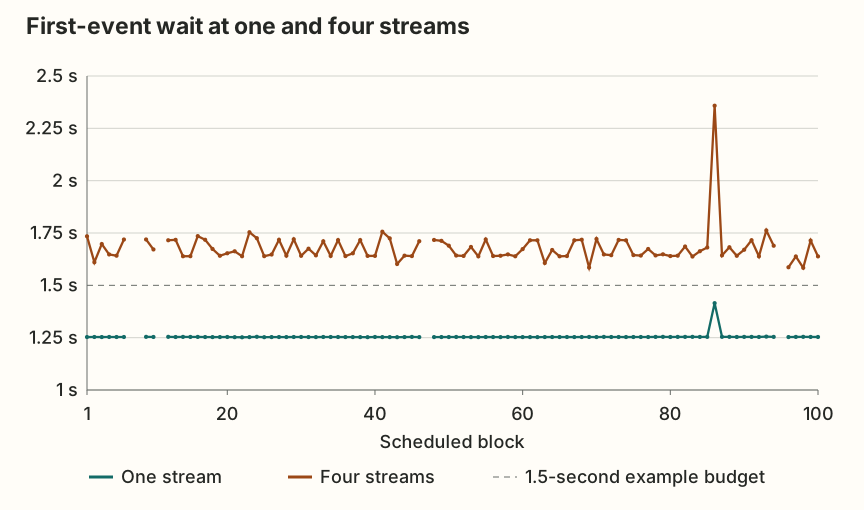
On our two Intel Arc Pro B60s, four streams delivered 2.30 times the aggregate output rate and added 0.40 seconds to the 95th-percentile wait for the first streamed event at the median across 95 complete blocks. At an example 1.5-second budget, both one-stream positions passed in every complete block. Four streams missed that budget in all 95. If chat is the priority, start with one stream and use the test below to see what four costs on your workload.
What four streams bought
The median aggregate rate rose from 43.45 to 99.88 output tokens per second. These are totals across the active streams. The latency numbers show the wait experienced by an individual request.
| Measurement | One stream | Four streams |
|---|---|---|
| Aggregate output rate | 43.45 tokens/s | 99.88 tokens/s |
| 95th-percentile first-event wait | 1.253 s | 1.653 s |
| Requests timed per block | 384 | 192 |
Check your own response-time budget
Use a test instance with the model, prompt lengths and output cap your app normally uses. Set the maximum in-flight requests in your load client to one, then four, then one again. Run the same prompts at each setting. Warm the server first and keep the warm-up consistent across runs.
Record the send time, first streamed generation event, completion time and task verdict for every request. Subtract the send time to get each delay. To calculate p95 in a spreadsheet, put the first-event delays for each setting in a column and use PERCENTILE.INC(range, 0.95). Tally failures and timeouts separately and count passing tasks per hour. Raise the limit for a batch only if the extra passing work is worth the wait on your test. See the inference measurement checklist for the timing and verdict fields.
| Budget | One stream before | Four streams | One stream after |
|---|---|---|---|
| 1.50 s | 95 of 95 | 0 of 95 | 95 of 95 |
| 1.75 s | 95 of 95 | 91 of 95 | 95 of 95 |
| 2.00 s | 95 of 95 | 94 of 95 | 95 of 95 |
Each cell counts blocks whose own p95 was within the example budget. Each position contributes 192 requests per block.
Five blocks stopped early
All 100 scheduled blocks reached an outcome. The 95 complete blocks recorded 54,720 successful responses across 57.96 hours of measured request-phase wall time. The five stopped blocks added 1,103 successful responses and one recorded error. The other 1,776 planned request slots had no terminal record. About 89.3 hours elapsed from the first block to the final one, including the pauses between runs. The study did not measure GPU utilization.
| Block | Successful | Errors | No record | Recorded reason |
|---|---|---|---|---|
| 7 | 144 | 0 | 432 | Cause unavailable in the earlier worker log |
| 8 | 48 | 0 | 528 | Shared-serving wait reached its limit |
| 11 | 95 | 1 | 480 | HTTP 429 from the gateway’s parallel-request limit |
| 47 | 528 | 0 | 48 | Shared-serving wait reached its limit |
| 95 | 288 | 0 | 288 | Shared-serving wait reached its limit |
After the 429, the benchmark key eventually had eight gateway accounting slots. The worker still sent at most four simultaneous requests. The record does not establish the exact gateway callback behavior that produced the 429. The last five blocks ran after a scoped admission renewal, with the five stopped blocks left in the ledger.
What the cards drew in a separate hour
In a separate 59.5-minute shared-serving window on November 8, the two exported card-energy counters rose by 0.245 kWh combined. That works out to 246.8 watts on average across the two cards. The counters include all work those cards served during that window.
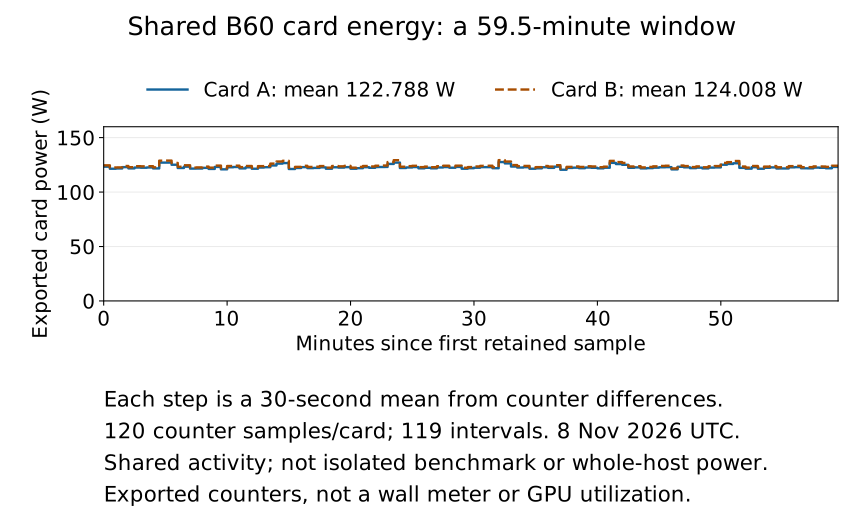
To estimate energy per passing task on your system, use a wall meter for a timed idle run and a matched load run. Subtract idle energy over the same duration and divide by the number of passing tasks. The card-counter window here has no matched idle run or whole-system reading.
How the test ran
Each block repeated a 48-request chat trace with a 256-output-token cap. The client ran one stream, four streams and one stream again, four times. The model server was warm and shared. The client used the same sampling settings throughout. The first recorded event can contain multiple tokens or reasoning text before the answer appears.
For each complete block, we summed usage-reported output tokens and divided by the recorded phase time for each stream limit. We pooled request waits at each limit before calculating the block’s percentiles. The 2.30× throughput and 0.40-second p95 changes are medians of the paired block comparisons. The audit checked request identities, counts, recorded times and usage. It counted completed transports and did not grade the answers. Other server traffic and fixed phase order can affect the comparison. The client did not independently verify the exact loaded checkpoint, tokenizer or server image.
Download the 100-block outcome ledger, 95-block comparison data, audit summary and trace fingerprint, or card-energy intervals. To check the headline results, take the median of the throughput-ratio column and the median of the paired p95 difference column in the comparison data. To check coverage, add the success, error and unrecorded columns in the ledger.